
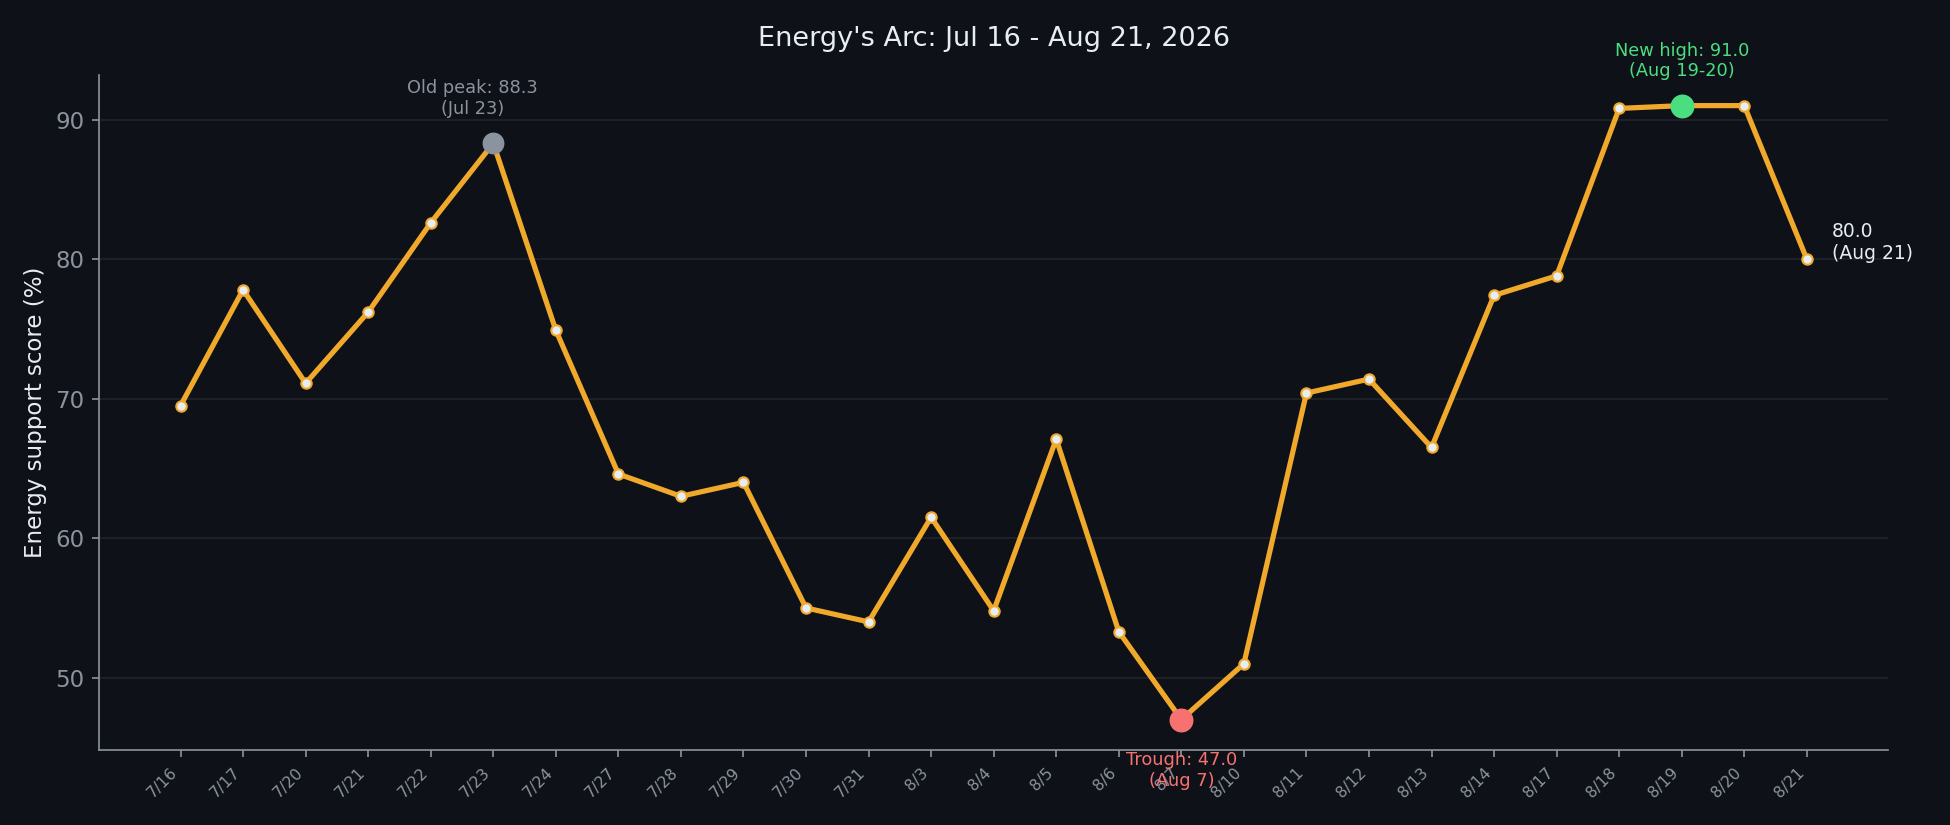
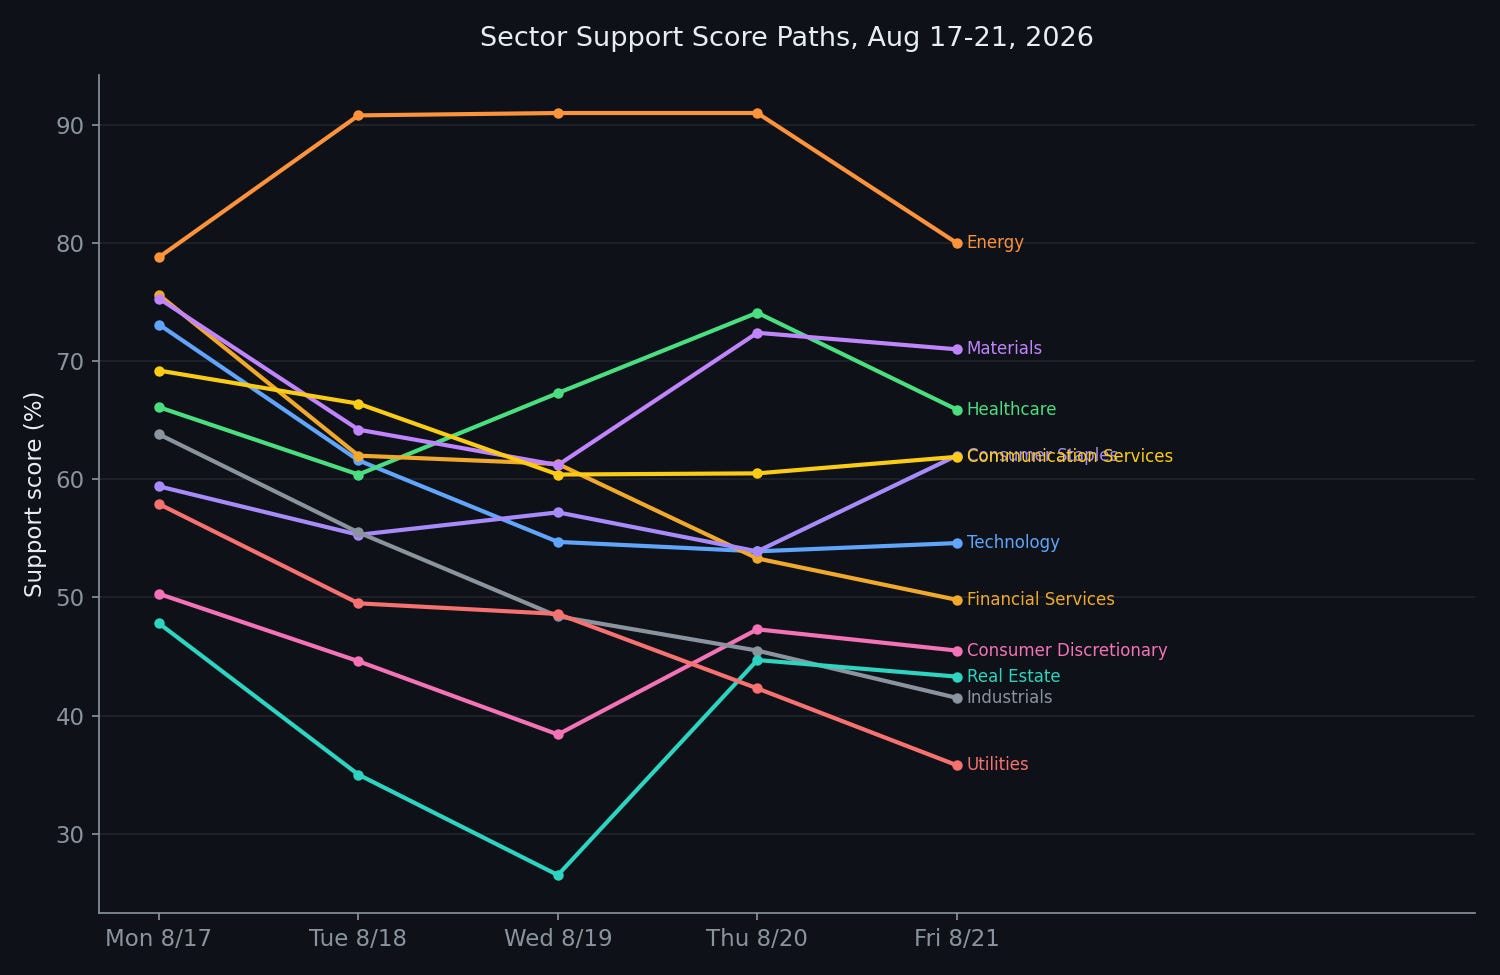
Energy hit 91.0 this week. That is the highest reading anywhere on my board recently, higher than the 88.3 peak that kicked off the whole “hard assets take the wheel” story back in July. It got there Tuesday, held it through Wednesday and Thursday, and then gave back eleven points on Friday alone, closing at 80.0.
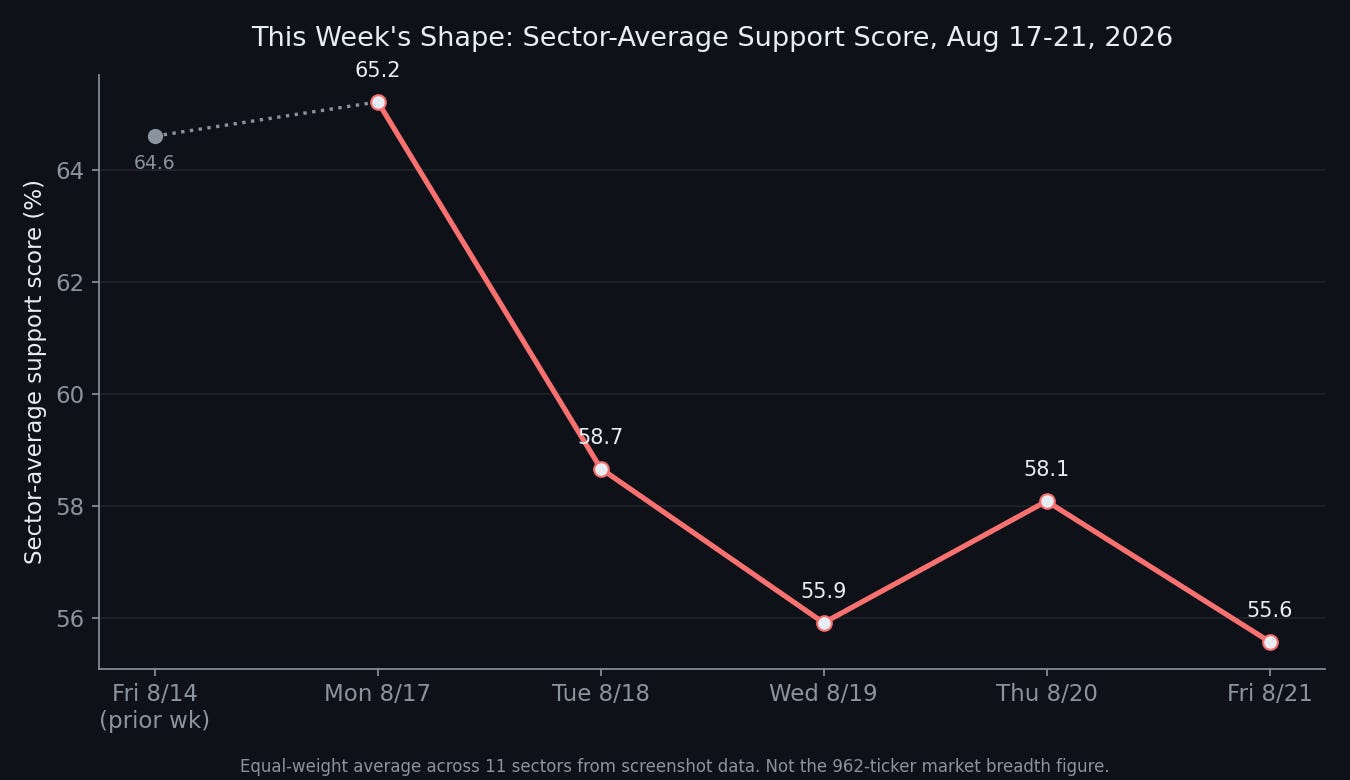
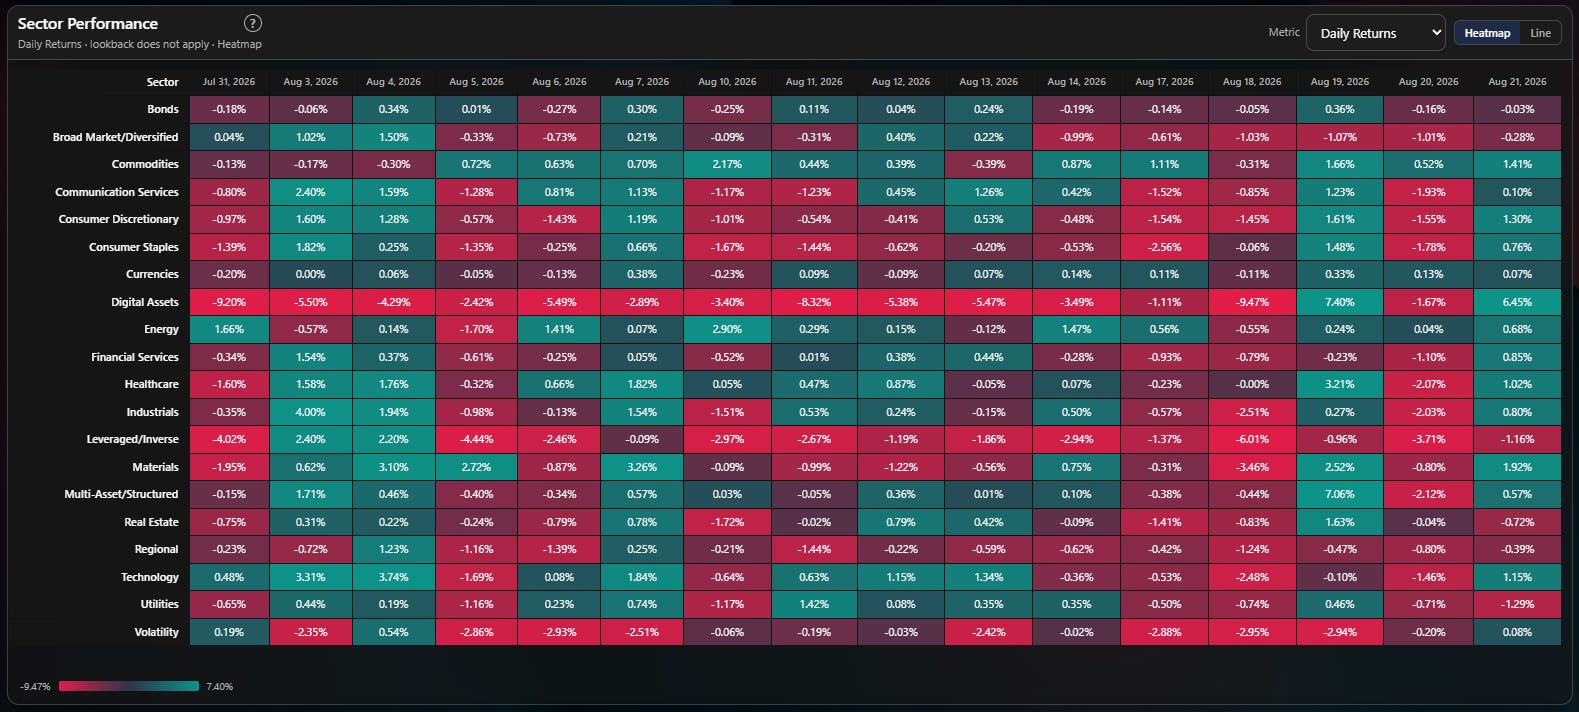
Everything else on the board went the other way from the start. The sector-average support score opened Monday at 65.2, close to last week’s strong Friday finish of 64.6, then fell for three straight sessions, 58.7, 55.9, before a small Thursday bounce to 58.1 gave way to another Friday decline, 55.6. Financial Services fell 25.8 points on the week. Industrials fell 22.3. Utilities fell 22.1. Technology fell 18.5. Nine of eleven sectors finished the week lower than they started it. Last week’s issue was headlined “Energy Changed Its Mind Again” and described a broad, ten-of-eleven rally. This week is close to the mirror image of that, minus Energy, which changed its mind twice more.
What actually happened
Strong economic data, and that is not a typo. One underlying fact underneath the entire week: the economy looked stronger than expected this week, and that is exactly what pushed yields up and stocks down.
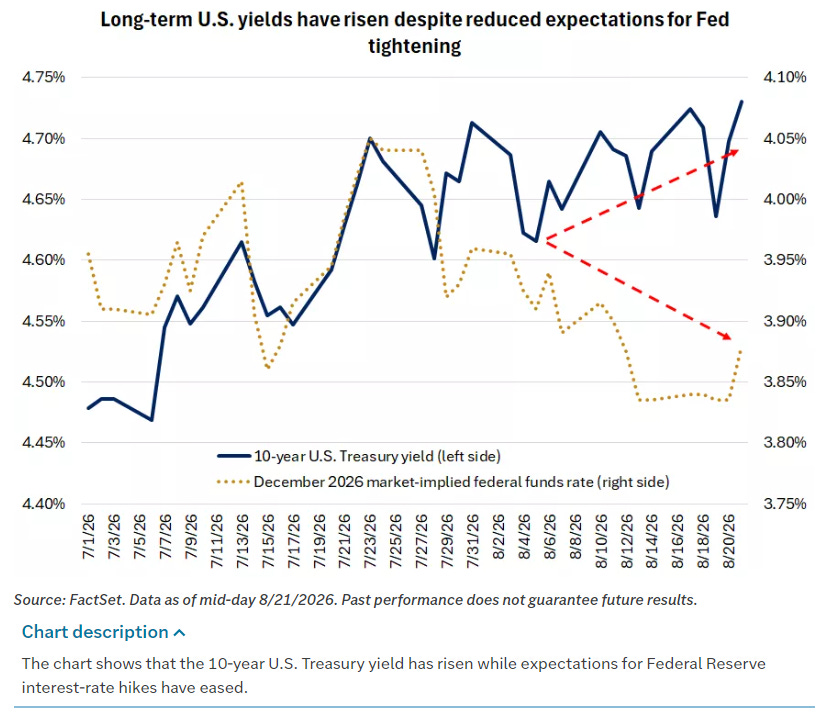
This is the good-news-is-bad-news dynamic, and it is worth spelling out because it is easy to get backwards. Stronger business activity data makes it less likely that the Fed will need to cut rates to support growth. Treasuries slid as investors reduced their expectations for Fed rate cuts, pushing yields higher. That pressure on long-term yields reflects both the immediate economic data and broader structural forces, including larger government borrowing needs and a longer-run shift in who buys government bonds. Higher yields, in turn, increase the discount rate applied to future earnings and raise borrowing costs across the economy. The effect tends to be greatest on sectors that are especially sensitive to interest rates by business model and on richly valued companies whose valuations depend heavily on profits expected far into the future.
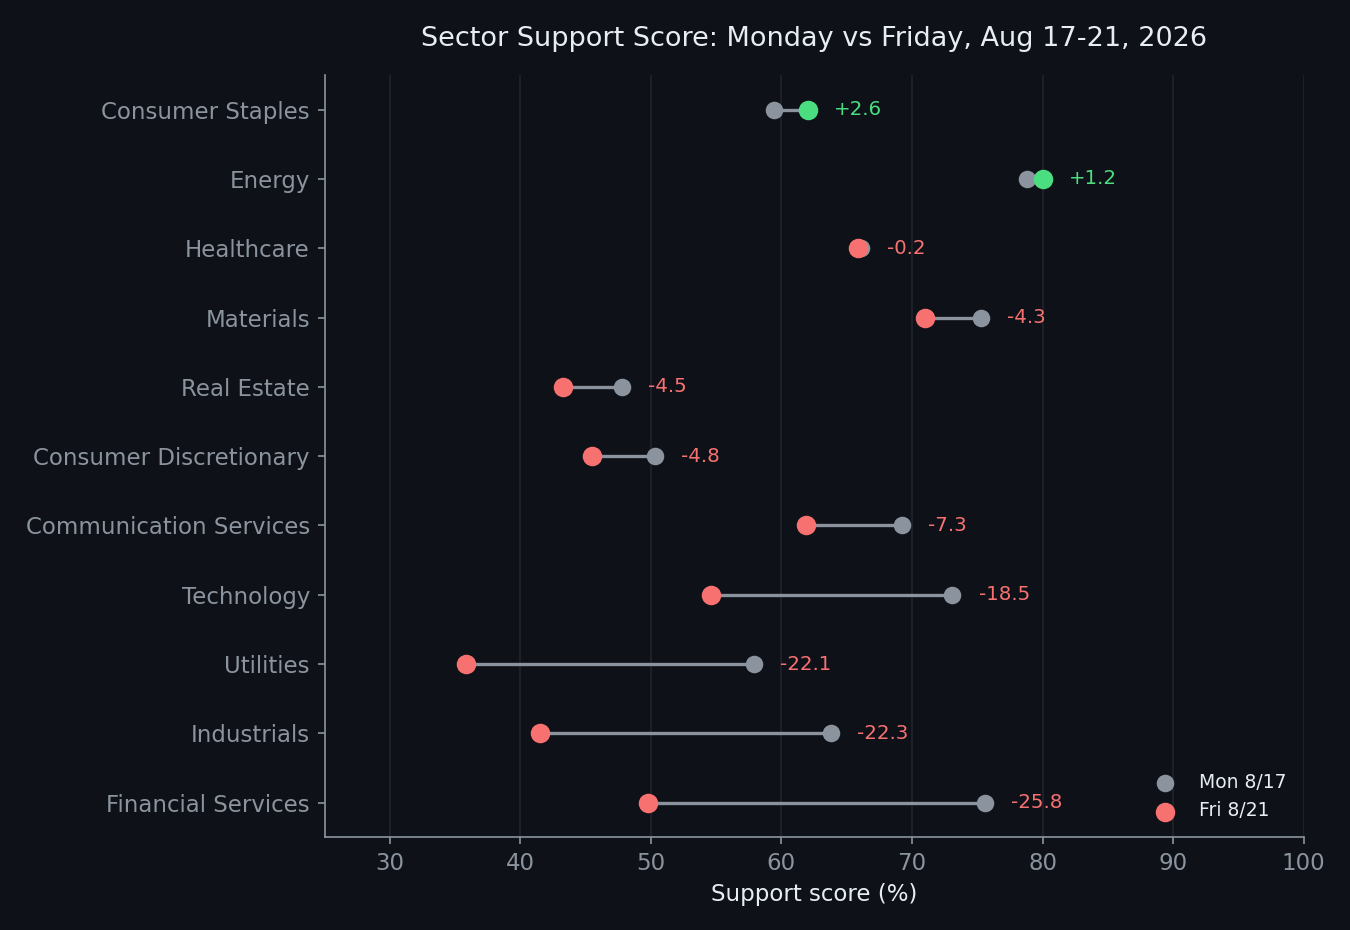
Look at who fell hardest this week and that mechanism is sitting right there in the data. Financial Services, Utilities, and Real Estate, three of the most rate-sensitive sectors that exist, were all red on the week, Financial Services the worst of the whole board. Technology, the sector most dependent on discounting distant future earnings, was the second-worst mover. This is about as clean a real-world demonstration of duration risk as this board can show. It is not a coincidence, and I would not call it a surprise either, once you see the yield move behind it.
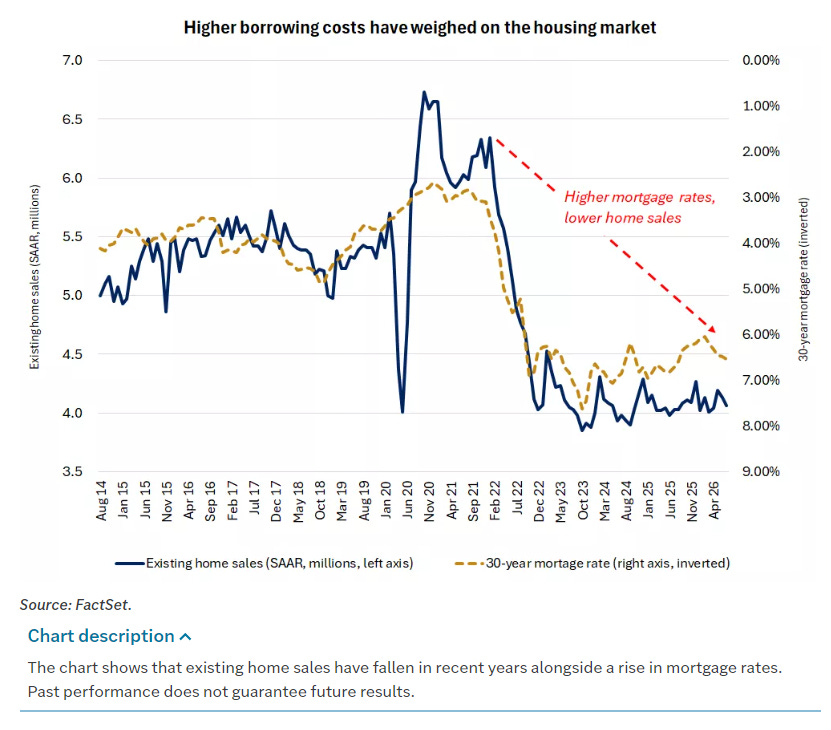
Worth adding a balancing note: housing stayed sluggish amid elevated rates and high prices, a sector that has been absorbing the higher-rate story for a while now and did not need this week’s data to tell it rates matter. Consumer Discretionary and Real Estate both landed in the red again this week, and both sit close to housing-affordability and financing-cost stories even when the headline news is about business activity broadly, not housing specifically. When multiple, only loosely related parts of the economy all point the same direction, rates, financing costs, forward earnings discounting, that is usually a sign the move is a genuine repricing rather than noise in any one sector’s data.
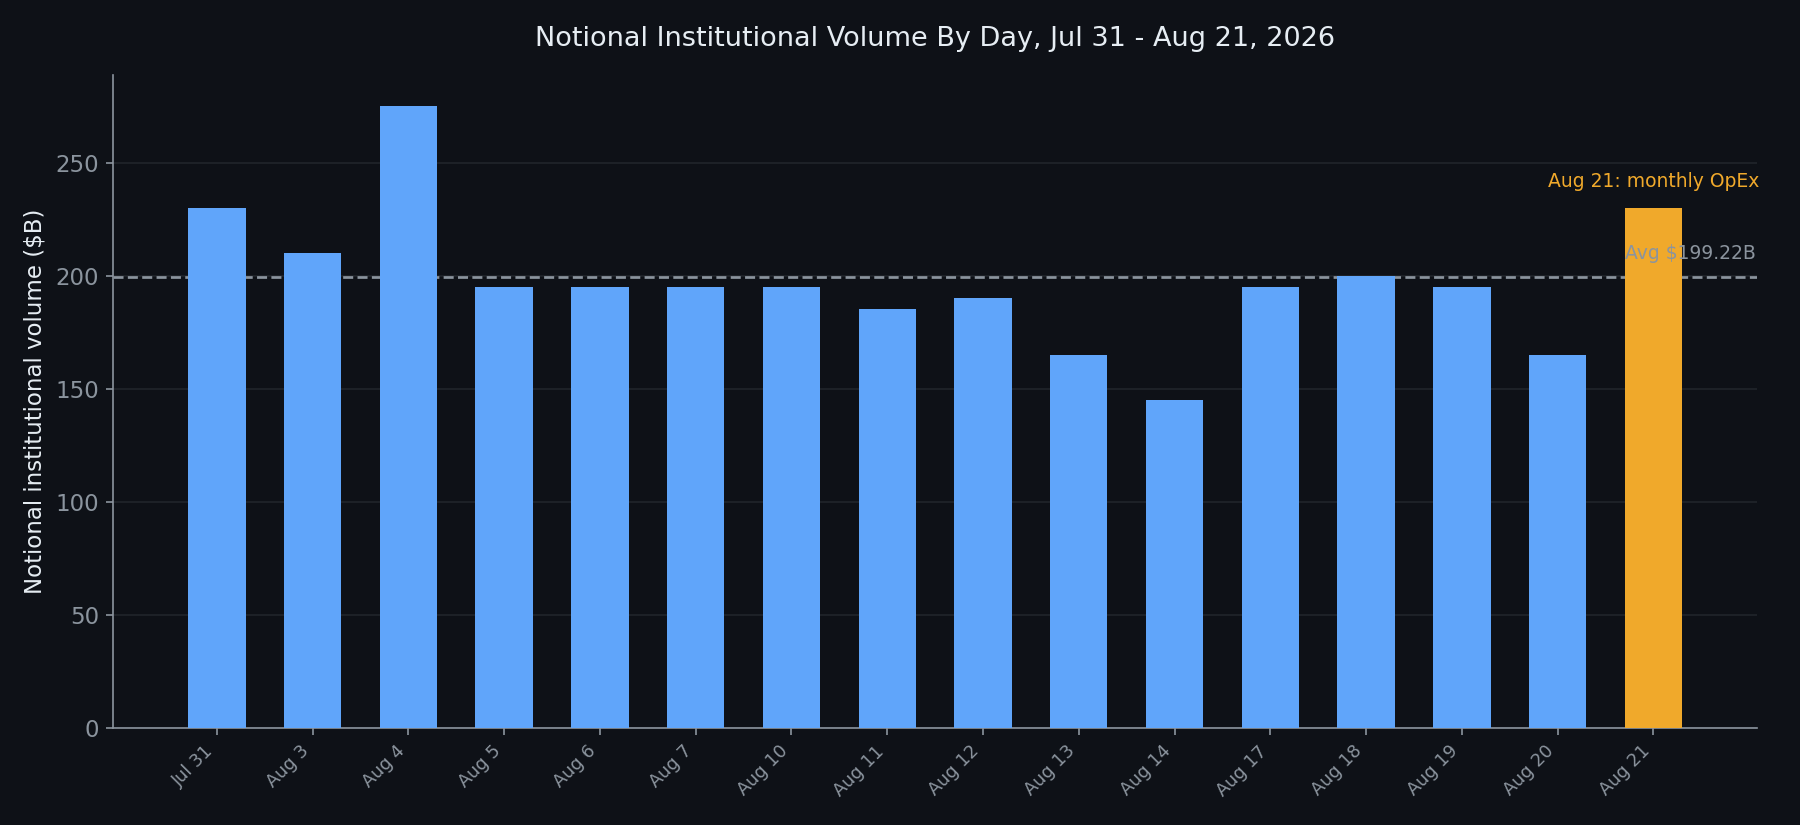
Worth checking that Friday’s reversal, in Energy and across the board, against volume, since Friday, August 21 was monthly options expiration, a date that can produce mechanical flow big enough to distort a single day’s reading on its own. It did not, this time. Friday’s notional institutional volume came in around $230 billion, above the running average of roughly $199 billion, but not meaningfully different from Jul 31’s $230 billion or well below Aug 4’s $275 billion, an ordinary Tuesday three weeks ago. OpEx barely moved the needle on aggregate volume this month. That is worth knowing because it means Friday’s selloff, and Energy’s reversal specifically, reads more like a genuine response to the yield move than a mechanical expiration artifact. A real repricing, not an options-driven wobble that unwinds itself by Monday.
Energy’s new high, and the fourth disagreement in a month
Energy making a new high while yields spike is, at first glance, the odd one out. It fits, actually. Rising long-term yields on stronger growth data often travel with firmer commodity demand expectations, and Energy is the one sector in my data that has spent the entire summer trading more on its own catalysts, first the Iran conflict, more recently whatever is driving this latest leg, than on the broad rate story that just hit everything else.
But the slower-moving/longer-term RRG is still not buying it. Energy remains in Weakening territory on relative strength and momentum, roughly 110 on the ratio axis and below 100 on momentum, exactly where it sat last week when the support score was 34 points lower. That is now three consecutive weeks of the price-based read saying weakening while the level-based read has gone trough, new high, and partial reversal, all in that same window. When I named the tell two weeks ago, I expected one of the two readings to eventually give way to the other. Instead they have just kept disagreeing, longer than I expected either one to hold out.
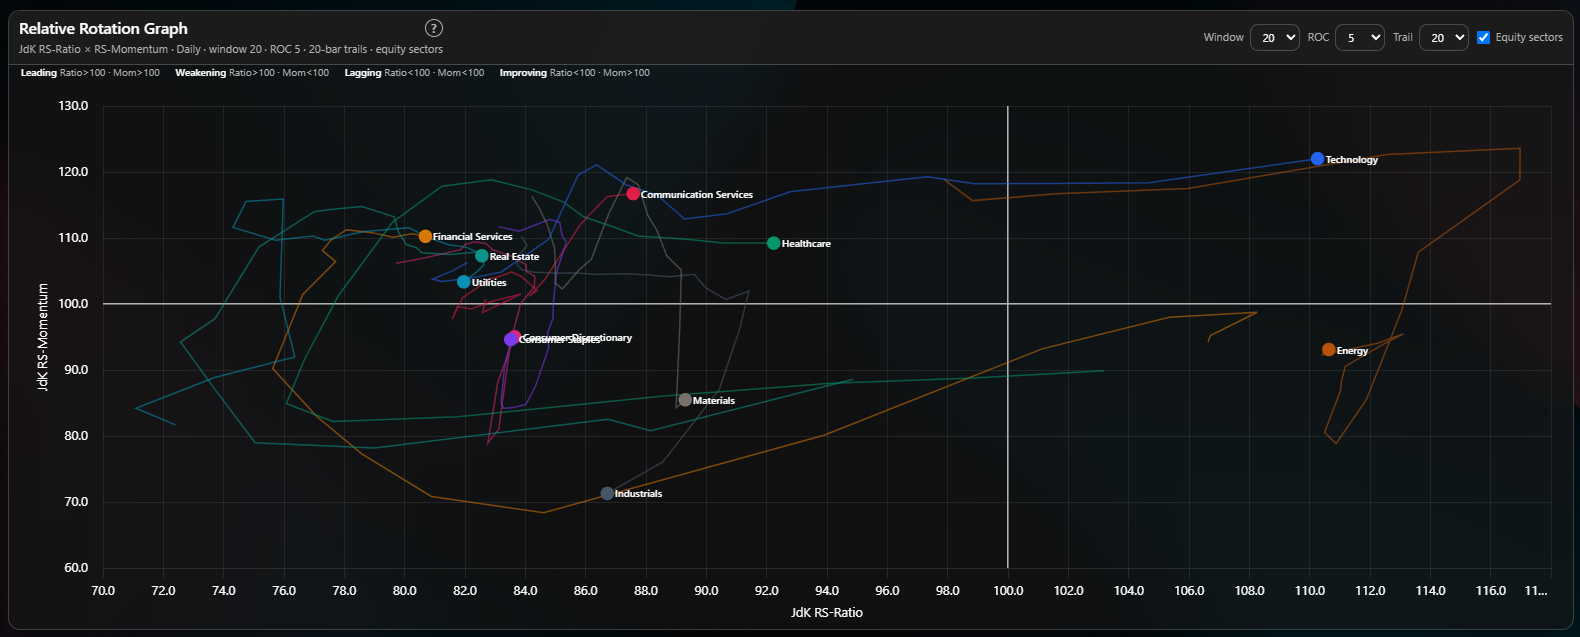
Technology is the more interesting divergence this week, because it runs the opposite direction. My support score for Technology fell 18.5 points, the second-worst move on the board. The RRG shows the opposite: Technology is now sitting deep in Leading territory, north of 110 on relative strength and above 120 on momentum, the strongest position of any sector on the chart. Both can be true without contradiction. A sector can fall in absolute terms while still beating the market, if the market fell more. This week, on a broad selloff tied to rising yields, that is plausibly exactly what happened, Technology gave back support-score ground in absolute terms while still outperforming the average stock. It is a good reminder that relative strength and absolute level positioning are measuring different things, and a bad week for one can sit right next to a great week for the other.
What the detailed breakdown adds
Friday’s box plot has a cleaner story than most weeks. Financial Services, Real Estate, Industrials, and Utilities, the week’s worst performers, all show medians sitting well below 50 percent with wide boxes, genuine across-the-board weakness, not just a few names dragging an otherwise fine sector down. For Real Estate and Utilities specifically, the mean sits above the median, meaning even the weak headline number is being flattered by a handful of stronger names, the typical name in each is worse off than its already-poor average suggests.
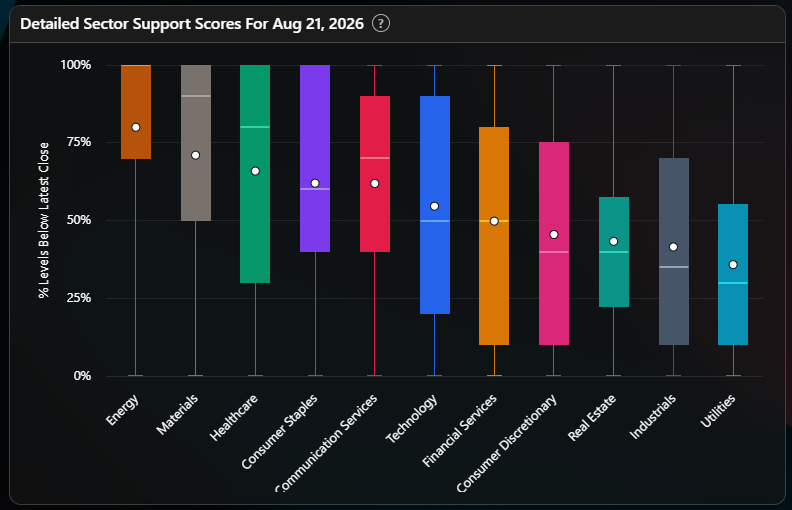
Materials is the interesting exception. Its median sits near the top of its range even though its mean is well below that, meaning a small number of clearly weak names are dragging the sector average down while most Materials names are actually holding up fine. If you only read the weekly heatmap, Materials looked like an unremarkable middle-of-the-pack sector this week. The typical name inside it was stronger than that. (Full walk-through on how to read this chart here.)
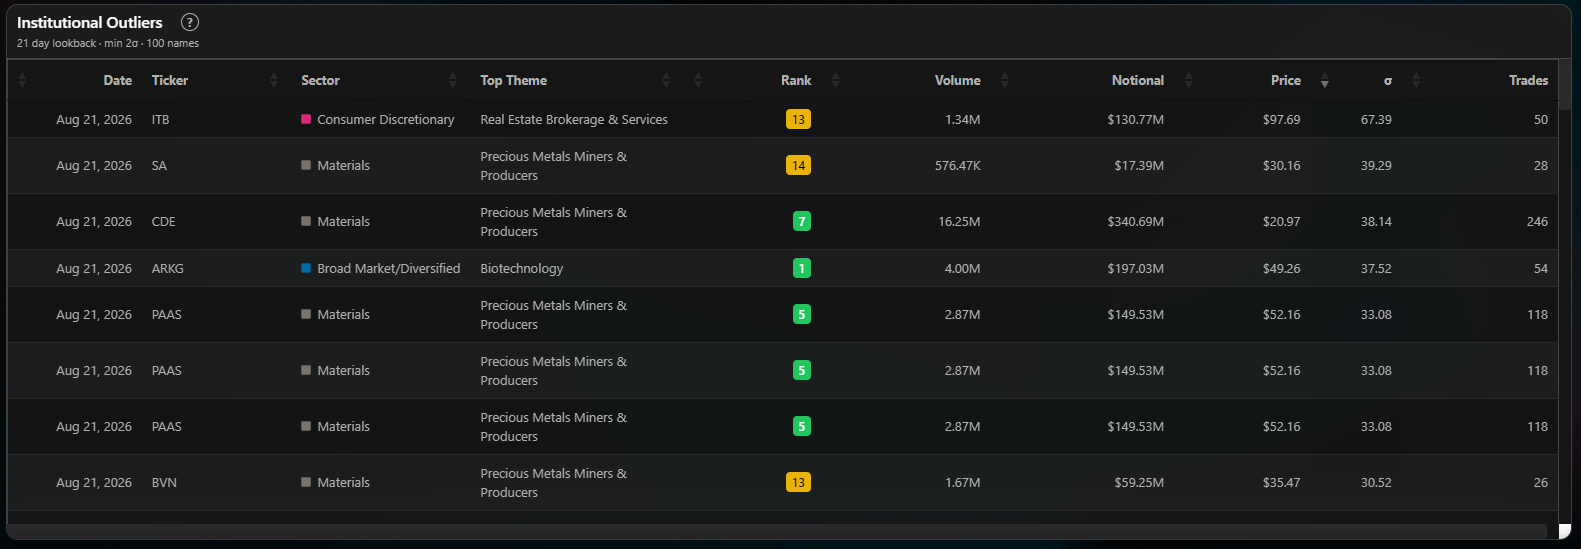
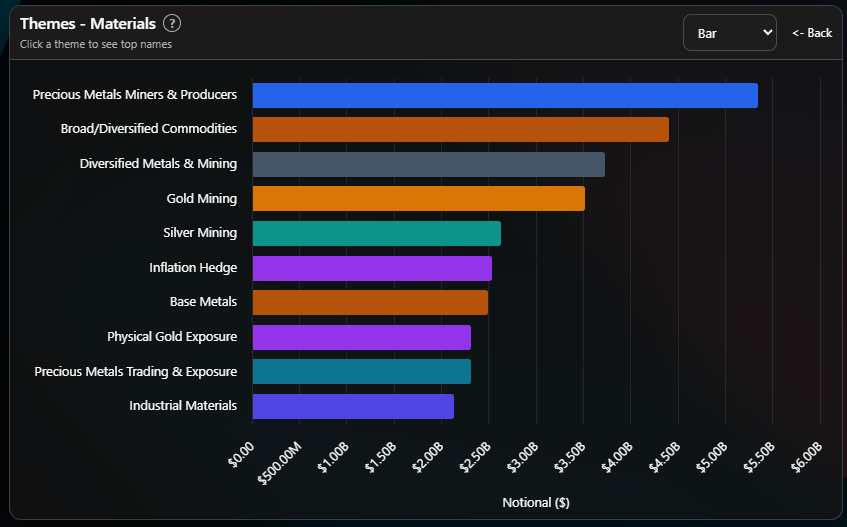
If we use the Sector Breakdown dashboard inside the VL platform to look at top thematics inside materials, it’s a gold and silver bonanza:
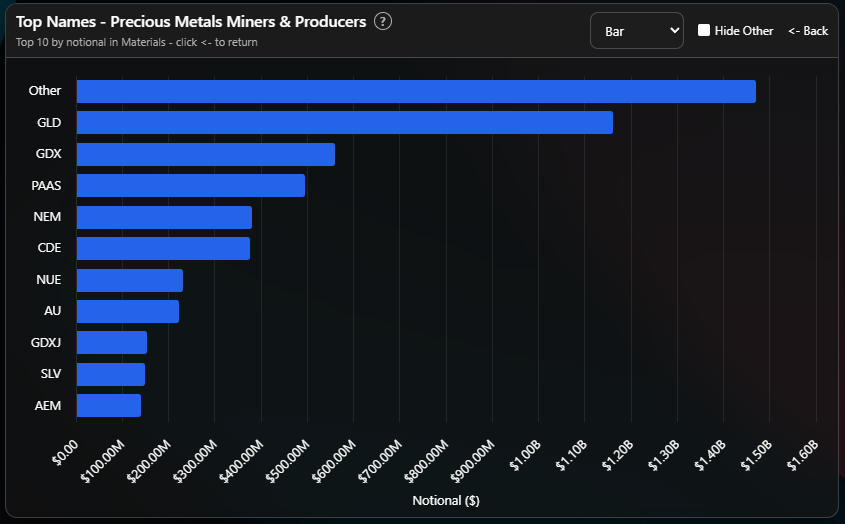
If you have access to VL, you can drill into any of these by clicking on the bar to see the top names by aggregate institutional dollars transacted, for example “Precious Metals Miners & Producers”:
What this means, by your clock
If you trade in days to weeks: this week had a real, identifiable catalyst, not a data quirk, stronger growth data pushed yields up and rate-sensitive sectors down. That kind of move tends to persist until the data or the Fed’s own communication changes the story, so I would not assume Monday reverses this on its own. Energy remains the one name on the board where I would size around uncertainty rather than conviction, four direction changes in five weeks is not a sector I would trust either the RRG or the support score to have right on its own right now, and Technology’s split verdict this week is a similar case for smaller size, not a hard bullish or bearish lean. Watch the box plot on Materials specifically if you are inclined to write it off, this week’s data says the typical name there held up better than the sector average suggests.
If you invest in months to years: the deeper story is a market that keeps discovering it does not know which direction the Fed is leaning next, and repricing hard each time new data shows up. Three weeks ago the story was oil-driven inflation risk. Two weeks ago it was cooling inflation and falling hike odds. This week it is accelerating growth and receding rate-cut odds. That much whiplash in the rate narrative, inside five weeks, is itself worth noting independent of which sector wins any single week. A market this sensitive to each new data print is a market without a settled view of where rates are headed, and that uncertainty itself tends to show up as exactly the kind of sector churn this board has been recording all summer, leadership rotating fast enough that last week’s winners are this week’s losers more often than not. Watch whether long-term yields keep climbing into next week or find a ceiling, that will tell you more about which sectors lead the rest of the month than anything in my board alone.
Talk soon, Bruce

Thank you for being part of this community and for investing your time in this week’s edition. The quality of this readership — thoughtful, disciplined, engaged — is what makes this work meaningful. I’m grateful to build alongside you. Here’s to a week of clarity, conviction, and well-executed opportunities.
— VolumeLeaders